How – and why – a veritable rainbow of tree types
has developed along Minneapolis streets.
Magnificent monoculture: the reign of the elm
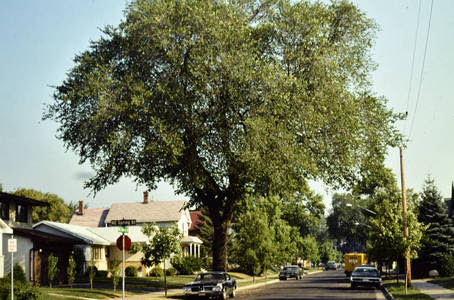
Did you know that elms once counted for more than nine of 10 street trees in the Twin Cities? It’s easy to understand elm appeal: streets lined with these trees, their branches arched high overhead, have been compared to cathedrals: sun-dappled green in summer; snow-frosted in winter.
Elms also offered considerable environmental benefits by virtue of their sheer size, a situation that became all too apparent in the aftermath of Dutch elm disease (DED). More than 400,000 elms resided in Minneapolis in 1963, when the first of them succumbed to the disease; more than half of those were public trees. The almost-total devastation unfolded over a couple of decades: In 1977 alone, some 31,475 public elms were tagged for removal because of DED.
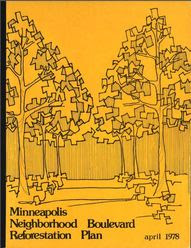
Designed diversity: the Minneapolis Boulevard Reforestation Plan
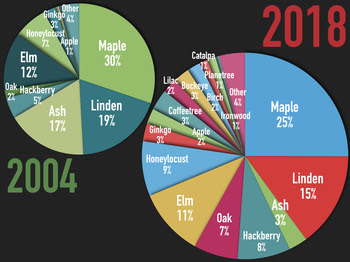
The Minneapolis Park and Recreation Board (MPRB), historic steward of the city’s street trees, was planting replacement trees by 1970. Its 1978 Minneapolis Boulevard Reforestation Plan provided neighborhood-based designs with several dozen tree types (species and cultivars) to replace lost elms. As most neighborhoods offered a virtually blank slate, the plan preserved the elm era’s consistent design aesthetic: A single type lined stretches of a neighborhood for five, 10 or even 15 blocks. Various types of ash, linden, honeylocust and maple tree categories (or genera) were the most popular, together making up over 70% of the street trees in the plan.
This system of “designed diversity” carried Minneapolis into the 21st century, long enough for these trees to reach maturity. In 2009, the emerald ash borer (EAB) arrived in St. Paul, just seven years after its discovery in Michigan. EAB has caused far less devastation than DED (which took some four decades to reach the Twin Cities); still, the rapid infestation helped prompt a whole new approach tobuilding a better urban forest.
Prescribed diversity: the right tree for the right spot
MPRB’s current street-tree diversity guidelines differ dramatically from its 1978 reforestation plan. Thanks to the digital revolution, GIS mapping, advancements in urban forestry and its own ongoing trials, MPRB “prescribes” diversity based on a wide range of measurements, data and science-based decisions.
In addition to increasing the tree canopy by planting the largest-maturing trees possible, the guidelines aim to develop diversity on three levels:
Citywide: The next generational leap in diversity means selecting hundreds of tree types from dozens of categories: oak, elm, locust, linden and more. Besides making for more colorful tree category charts, this wider range creates resilience against the next disease or invasive pest that may target a whole category.
Neighborhood: Ten percent is the neighborhood limit for any tree category. This means for the most part that MPRB is not planting maples, which make up 30% of the trees in some areas. On the flip side, look for more coffeetrees, catalpas, birch and other categories that have less than a 10% presence in any given neighborhood. (Many of 2018’s most-planted species were profiled in the last tree-planting update.)
Block-by-block: At least three to five different tree categories are prescribed for an individual city block, which prevents a disease or pest from totally wiping out a large swath of trees.
The bright side of blight: We might mourn those areas that lost stretches of exclusive, mature ash trees from the late ‘70s and ‘80s – just as the giant elms that preceded them were mourned by previous generations. But looking on the bright side, these places are also at the forefront of MPRB’s efforts to develop a healthy urban forest for the next century.
Next update: Reporting on 2018’s new trees
For the season’s final update, we’ll share figures related to the trees planted and examples of places where the new, resilient urban forest is taking hold.
In the meantime:
- Remember that a newly planted tree is a thirsty tree! Please water all trees, especially young ones.
- Find out more about MPRB’s park care and maintenance and its stewardship of the urban forest and park trees.